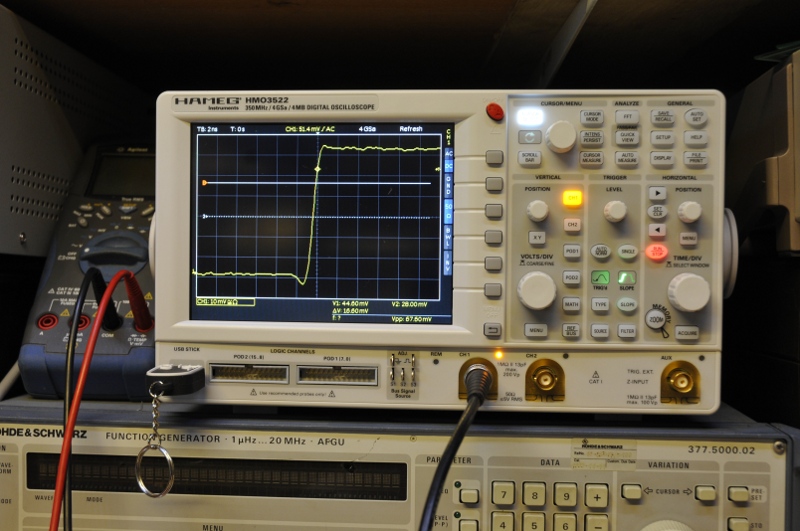
Since a while, Hameg is part of R&S and that is not a bad thing. I had a Rigol DS1102 but after the trigger knob dropped of because the flimsy construction. I was not satisfied by the performance too, so I wanted a better scope. I wanted an Agilent 2000 or 3000 but a friend told me about the Hameg. It had almost the specs of the Agilent 3000 but the price of the 2000 and it was 350MHz.
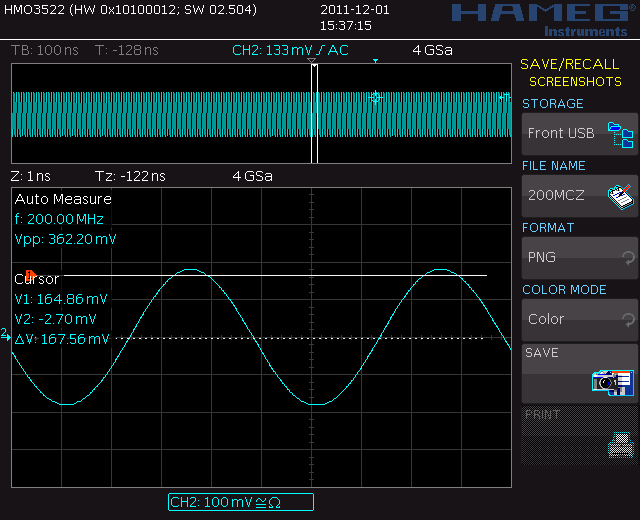
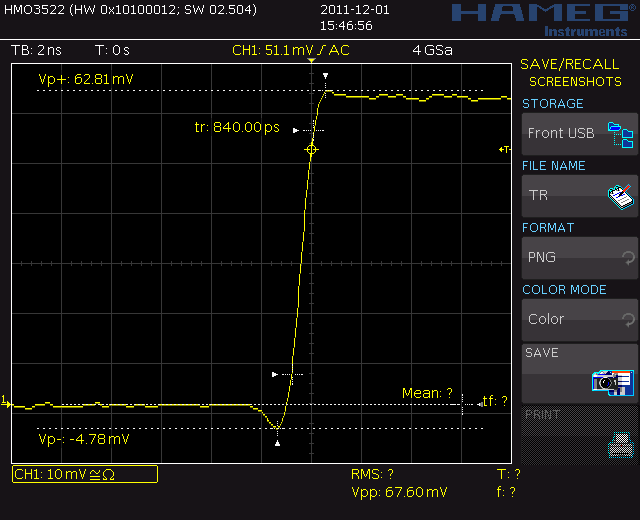
It is a 2 channel scope, 350Mhz 4Gsa/s and has 16 digital inputs. It is one of the few scopes that has a real 1mV/div input. The low noise ADC is good enough to do it this way instead of the usual software “zoom” . Also the horizontal (15ppm) and vertical (2%) accuracy are above average.
Update 2015: I still use it, almost every day a few hours. It is still spot on. Not a single problem since I bought it. Today the Hameg label is gone and they sell the former Hameg gear as R&S. Not strange, it was designed and made by R&S.
update 2017, I died on me so I repaired it. The build quality was very good. Probably just bad luck.
Since this scope I am a bit a Hameg fan. My good friend Rene has a huge Hameg collection. Old and new and I have tried his gear the times I was visiting him. Very nice performance and high quality. I love the 8000 system so much it replaced my Tek 5000.
Some impressions:
The zoom function is the modern variant of the delayed timebase. But it is much more than that.
Most DSO’s have FFT and new is the HiRes function. The ADC behaves in that mode as if it has more bits. It is based on oversampling and taking box averages. On my Rigol i did not use it much. The scope had no 50 ohm input and no dBm option like a normal SA.
So I set up my HP8640. Checked the signal on amplitude using a HP selective voltmeter, a RMS meter, the scope and the SA. The Frequency at 10MHz was checked on my GPS locked counter.
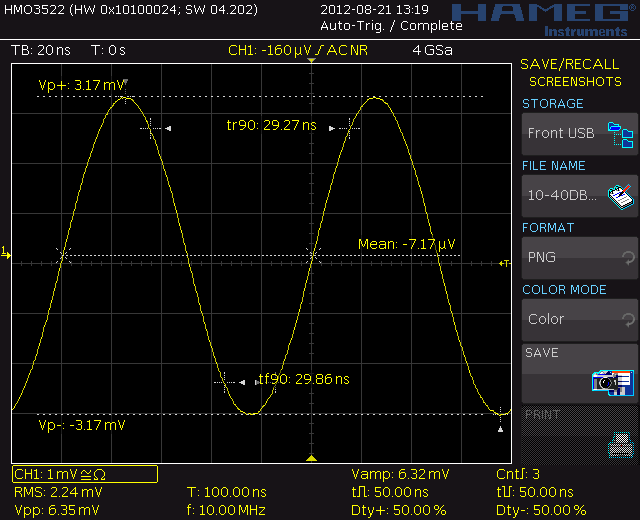
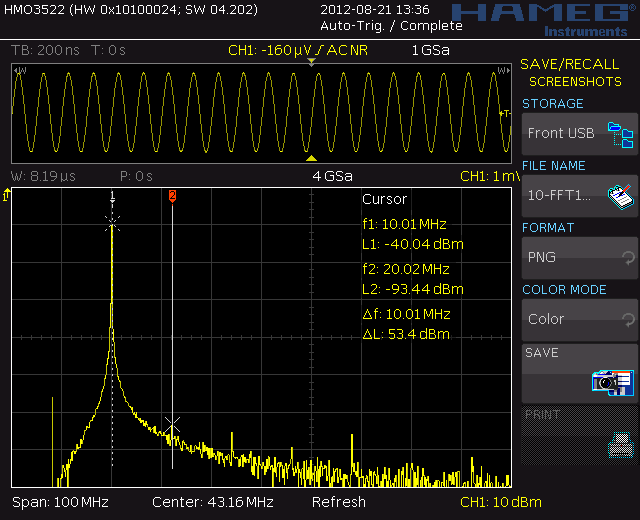
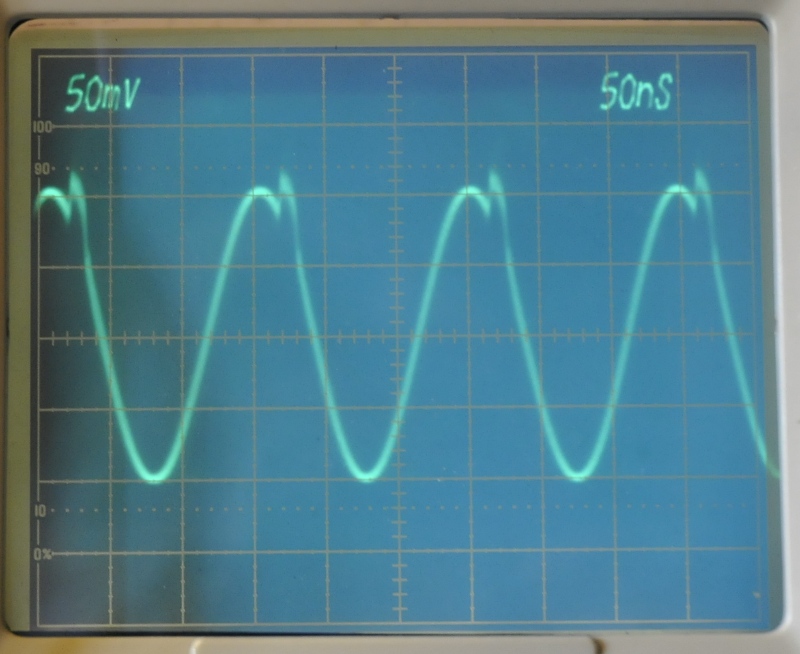
First a shot of the signal in the timedomain. A -40dBm signal at 10MHz
I took -40dBm because then the scope and SA need a real low noise ADC so this is a hard test. We are talking 2.2360679 mVrms or 6.324555 mVpp so the scope is very close. The frequency is 10MHz and the scope is set using the autoknob so nothing fancy or tricks.
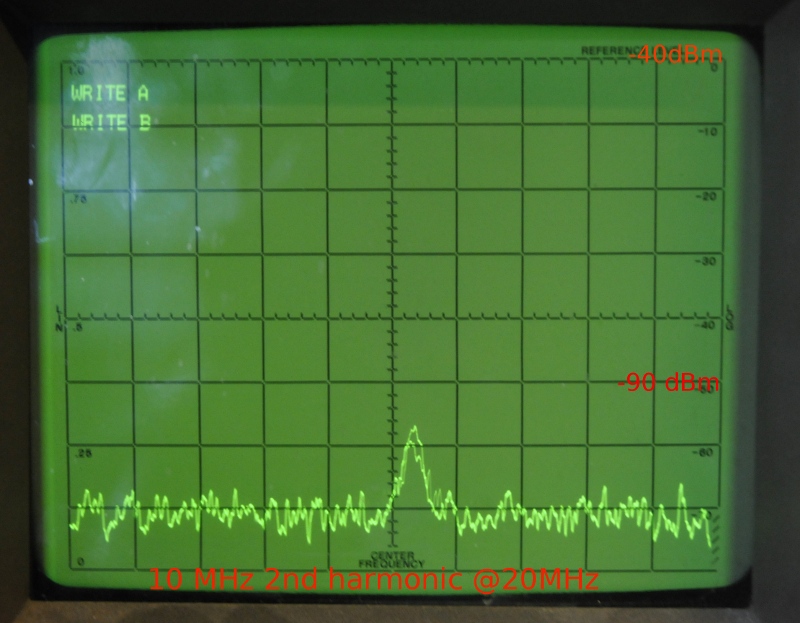
The second harmonic. Because it fluctuates between -93 and -100 it was hard to capture and impossible to see it together with the first harmonic. To get the noisefloor down you need to lower the bandwidth and this way I could only zoom at the 20MHz signal.
I always told people, FFT is no substitute for a scope. And in some cases I’m still right. If I had to align a filter for optimum suppression of this signal, this SA is fast enough. But I could not see the other harmonics (nb; this is a -40dBm signal, if the amplitude is -20 it is no problem)
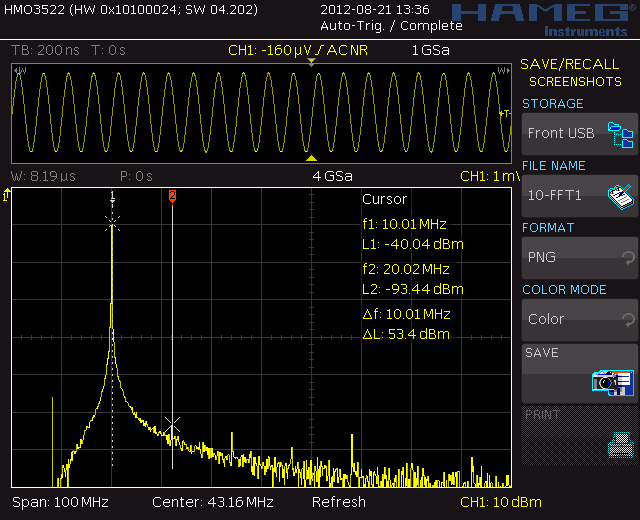
Lets look at the FFT from this Hameg:
You see the amplitude is -40.04dBm that is very close. Just a 10.27 uV difference. Turning the connector or walking by can give a bigger fault.
No difference in samplerate so hires does not function here.
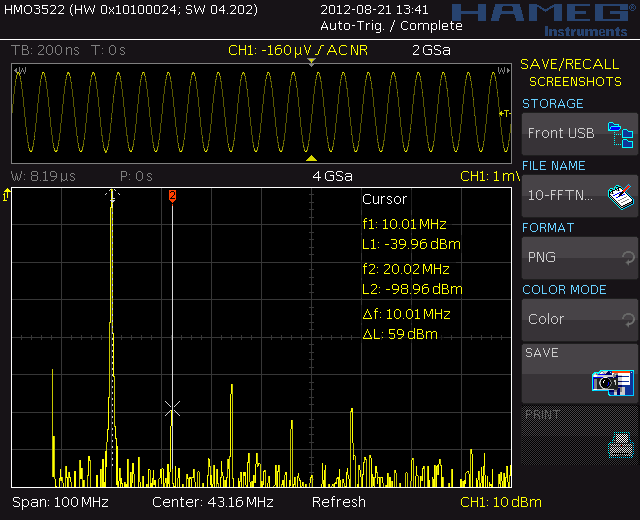
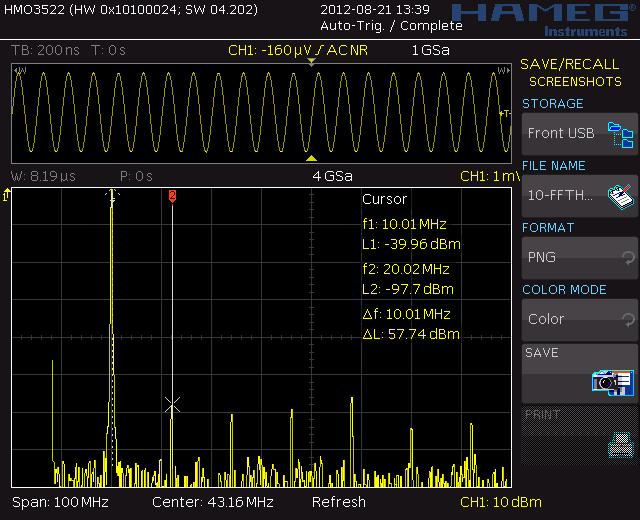
The filter decreases the noisefloor. What I could not do using the analog SA was no problem using the FFT. But it takes a few seconds to make a picture at 32768 points.
Amplitude is again spot on, The second harmonic at -98.96dBm is easy visible. Noisefloor is at a very impressive -110 to-120dBm.
This gives a problem, look at the amplitude of the harmonics. Because the analog SA has not a huge span it it very hard to see what mode is right. So we need a stronger signal.
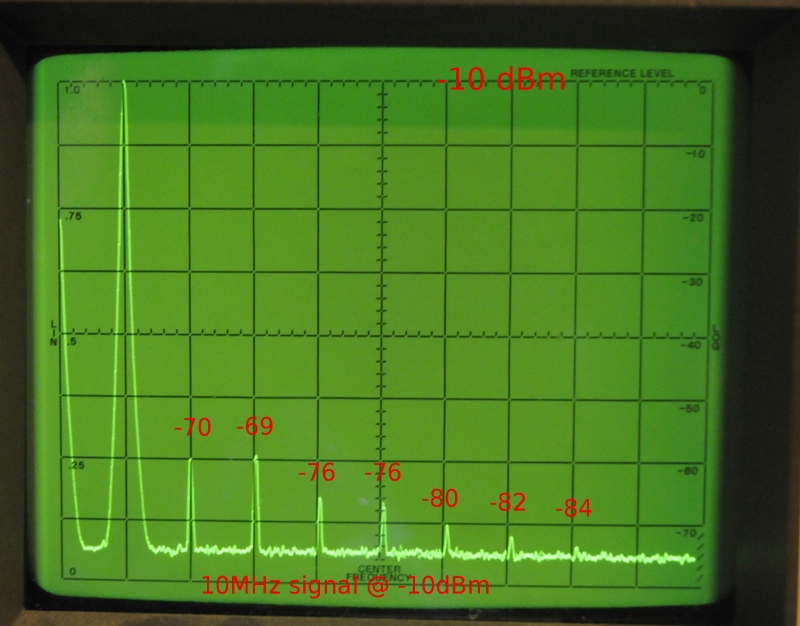
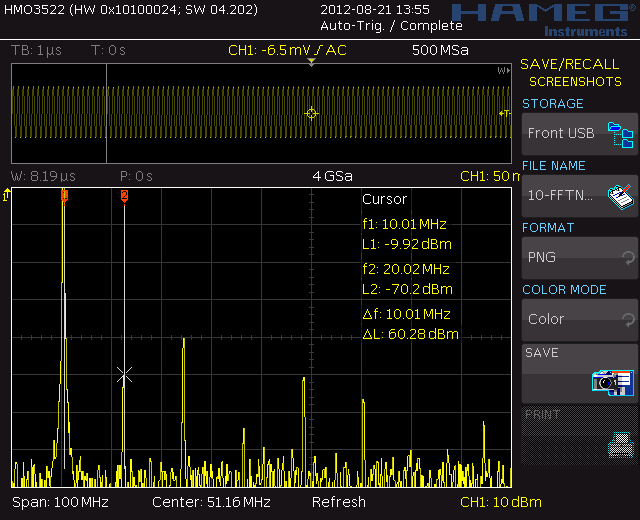
The signal on a HP5885B spectrum analyserThis is what we should see using -10dBm at 10 MHz.
Harmonics -70.2, -60, -84, -70, -76, -90, -82
deviation from real: 0 +9 -8 +6 +4 -8 +2
Hires mode had the same sample rate and same picture.
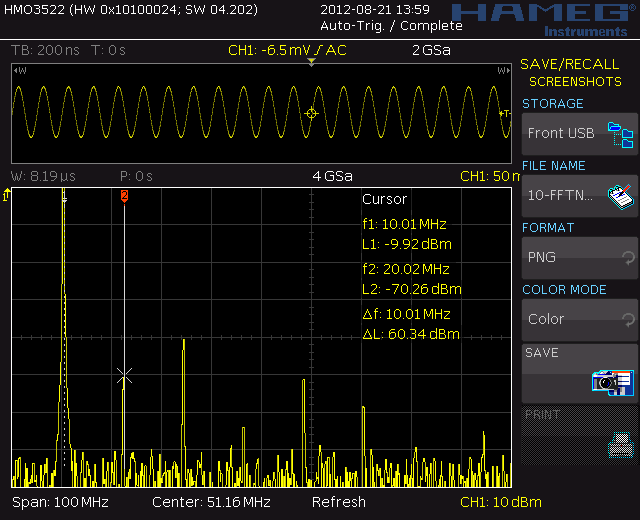
So a 200nS timebase, normal mode. Now we have
Harmonics: -70.26, -60, -84, -71, -78, -89, -85
deviation: 0, +9 -8 +5 +2 -7 -1
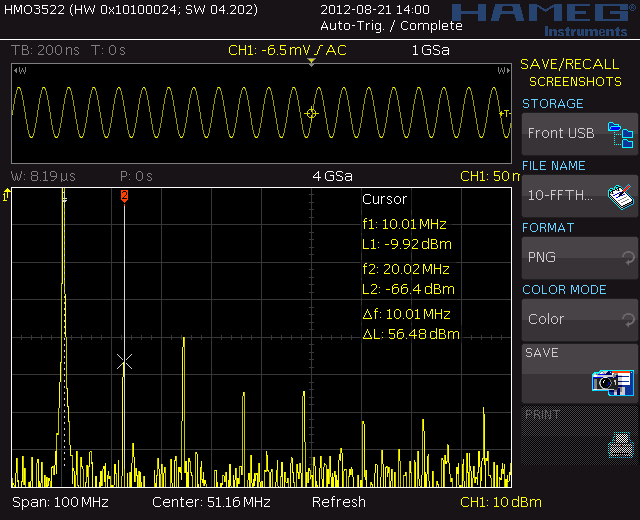
1Gsa/s hires mode at 32768 points
Harmonics: -66.4, -60, -75, – 75, -82, -81, -78
deviation: +3.6 +9 +1 +1 -2 +1 +6
This is a better result as the normal mode.
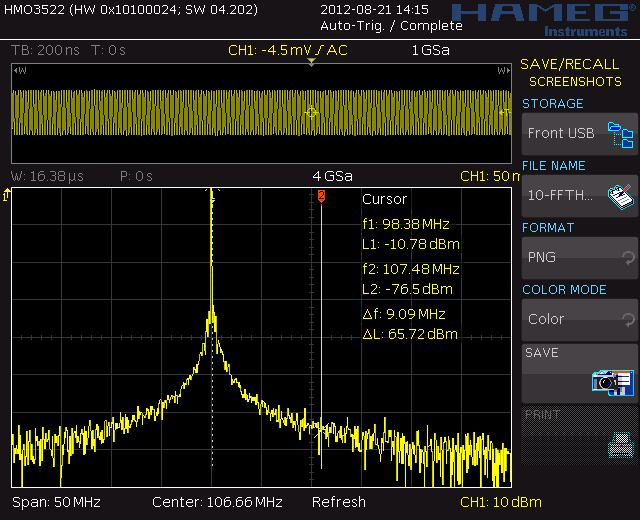
The noise floor is rectangulair around -80dBm. The signal is -10dBm
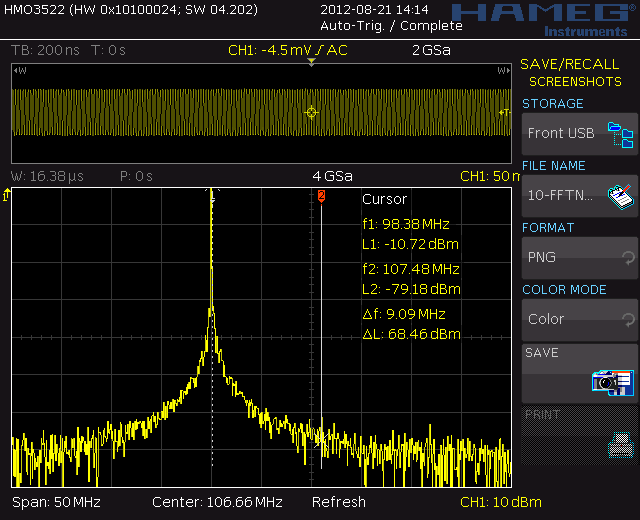
No visible difference and not usable for looking at phase noise
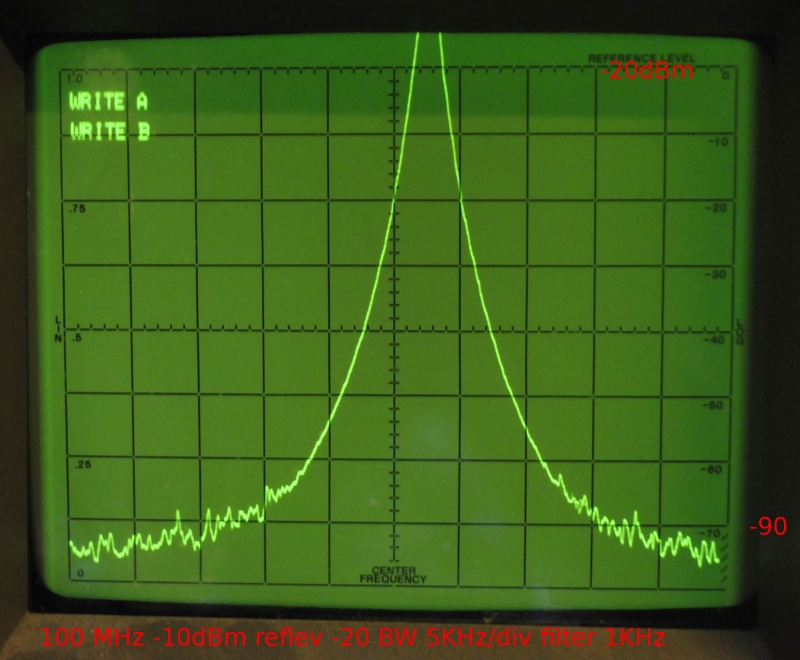
The noise level is at -95dBm, here the SA rules. You get a good look at Phase noise. The picture looks the same in scale but the scale is here 5KHz/div and a 1KHz filter, instead of over 4MHz/div on the FFT.
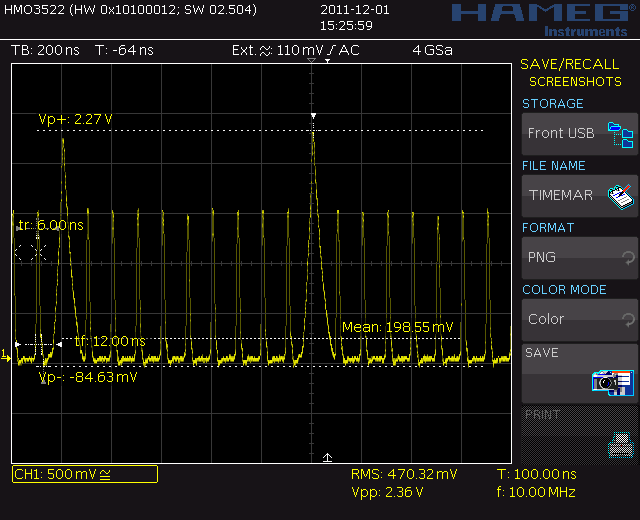
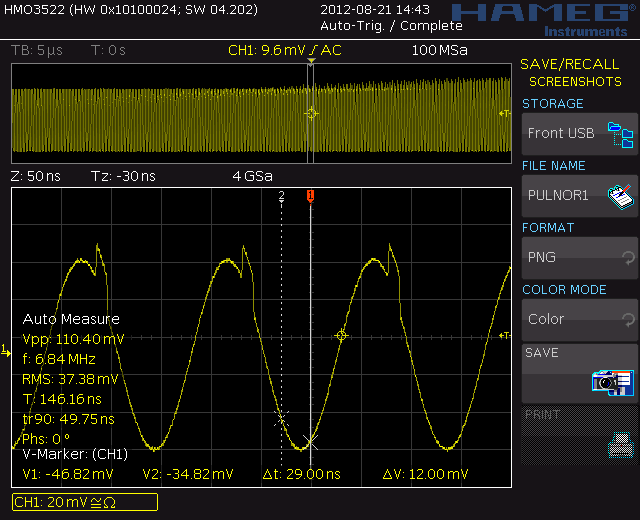
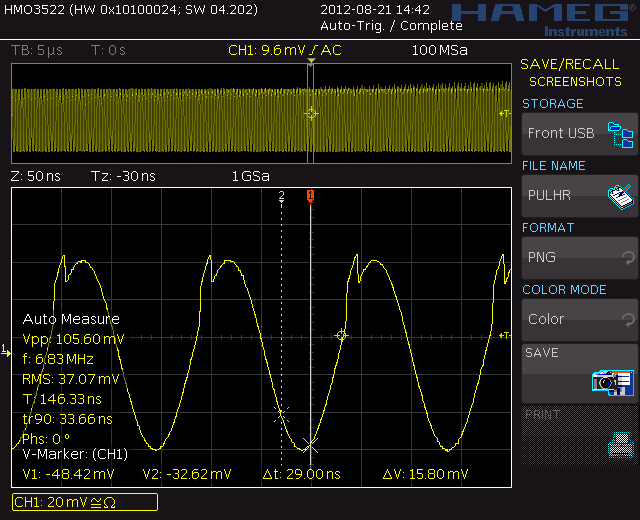
According to a video of a Agilent 9000 Hires mode makes it possible to see things like above. A pulse and sinewave via a combiner. The pulse is about 15mV
The pulse in Hires mode, no difference, sample rate 1Gsa/s instead of 4.
The 7704 has no problems showing it too.

